
Market Sizing — TAM, SAM, SOM
Most nature-data pitches quote one big number — the whole of nature finance — and call it their market. That is where the credibility goes. CeibaQ does not sell credits or bonds, so the whole of nature finance is not our market. We size this the disciplined way, as a classic funnel from the total market down to what we can realistically take, and the single most important move in it is that we count only the slice spent on monitoring, not the financial flow it sits inside.
How we size it
- TAM — total addressable market. The entire flow of nature-finance instruments that legally or commercially require verified nature data: carbon credits, biodiversity credits, nature debt, results-based forest funds, ecosystem insurance, and nature disclosure. Globally about $11.5–16.8B a year today; in the Amazon, our geography, about $3–6B a year. We do not earn on the credit, the bond or the policy itself, so this is the size of the space, not the size of our market.
- SAM — serviceable addressable market. Only the share of that flow spent on data, measurement and verification (MRV), and only in the Amazon. This is the layer all five income streams actually sell into: about $240–560M a year, midpoint near $390M. (Globally the MRV layer is roughly $1B today; we focus on the Amazon.)
- SOM — serviceable obtainable market. What CeibaQ realistically captures: modelled revenue $7.4M in 2028 rising to $108M in 2035, a single-digit percentage of the SAM.
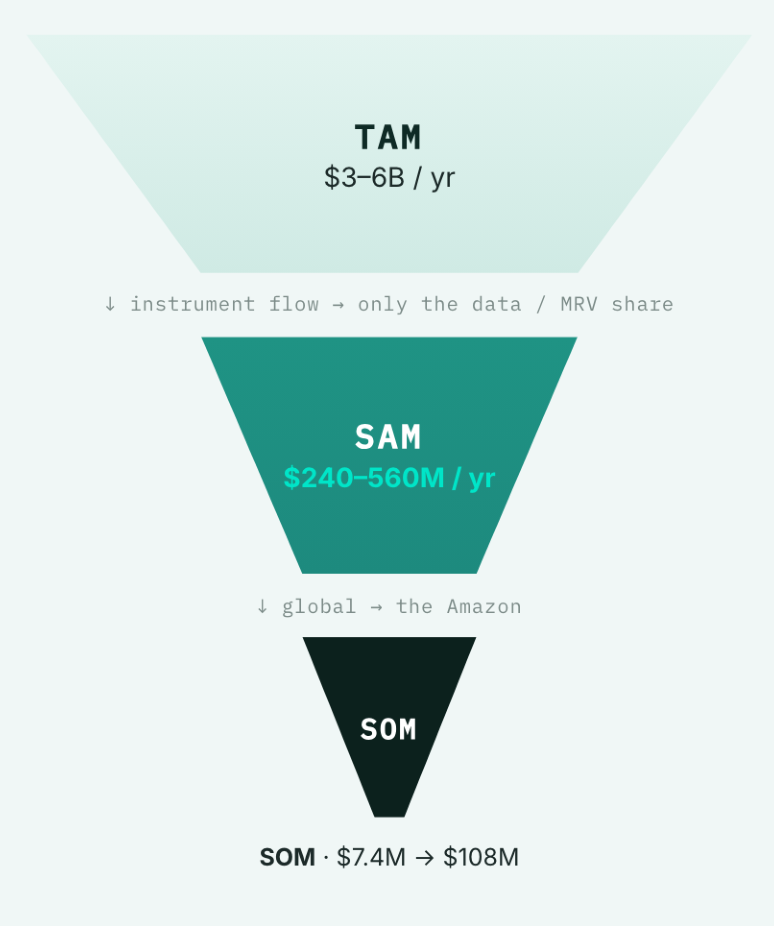
Why our market is the monitoring slice, not the whole flow
CeibaQ does not issue credits, does not write standards, and does not hold bonds. It sells the evidence layer underneath all of them. So the only part of each instrument that is ours is the spend on data, measurement and verification — from about 1–3% of value in mature segments like forest carbon and nature debt, up to 25–45% in biodiversity, where the measurement is still embryonic and expensive. Taking the whole instrument flow as the market would overstate it by ten to a hundred times. We carve down to the MRV share on purpose, and that carve is the difference between an honest market and an inflated one.
The big number still matters — as value-at-stake
The instrument flow is not our revenue, but it is the reason a buyer pays at all. As the rules tighten, a credit, a bond coupon or an insurance payout increasingly cannot be issued without defensible evidence of the forest's condition. So the $3–6B of Amazon instruments is the value at stake behind our contracts: the larger that flow, the more a buyer will pay to protect it. We use the big number to explain willingness to pay, and the SAM to measure what we earn. We never mix the two.
What CeibaQ captures (SOM)
| Year | Revenue (model) | Share of the Amazon MRV layer | Stage |
|---|---|---|---|
| 2028 | $7.4M | ~1–3% | first revenue (IS1 + IS2 + IS3) |
| 2031 | $53.9M | ~2–5% | proving the rail |
| 2035 | $108.3M | ~3–6% | category leader |
Revenue is the financial-model projection (see Financials). All figures past 2027 are management estimates gated on execution, not forecasts; 2035 is a modelled endpoint, not a contracted result. The capture share is measured only against the SAM, our addressable MRV layer, never against the larger instrument flow.
Reaching the modelled 2035 revenue requires capturing only about one twentieth of the Amazon monitoring layer, on a market that is itself growing. This is a small-share business in a large and expanding space, not a company that has to win the whole field.
The market validates two ways
- Top-down: the data and verification share of each instrument flow, summed across carbon, debt, results-based funds, insurance and nature disclosure, net of overlap → $240–560M.
- Bottom-up: 35–80M addressable Amazon hectares at $2.50–5.50/ha/yr = $88–440M, plus the net nature-disclosure data layer of $50–120M → the same $240–560M.
On the integrity-driven trajectory the SAM grows to roughly $1–3B by 2031.
Why the market grows: the regulation tailwind
This is not a market waiting on consumer adoption. It is being built by rules with dates attached:
- EU Deforestation Regulation — main obligations from December 2026, requiring geolocated, due-diligence-grade land-use data for cattle, cocoa, coffee, palm, rubber, soy and timber, exactly in the tropical geography CeibaQ measures.
- Article 6.2 of the Paris Agreement — moving real money; the Singapore-Peru channel is live, paying a premium for verified, sovereign-grade credits.
- CORSIA — the global aviation offset scheme, mandatory in its second phase from 2027.
- The Tropical Forests Forever Facility — first per-hectare verified payouts from 2028; Peru's RENAMI operationalises nested REDD+ over 2028–2029, the regulatory backbone of CeibaQ's home jurisdiction.
- The Kunming-Montreal Global Biodiversity Framework — anchors corporate nature disclosure toward 2030, turning biodiversity measurement into a paid requirement.
High-integrity removals traded about 381% above ordinary reductions in 2024. The market is paying up for verified — the product CeibaQ sells. (Market averages, not project-level guarantees.)
The asymmetry: carbon now, biodiversity later
The share spent on data grows inversely to how mature the measurement is. Where the metric is settled, as in forest carbon, data is roughly 7–15% of value; where it barely exists yet, as in biodiversity, it is 25–45%. The largest rent sits where the standard has not been written.
- Carbon is the cash flow today — the mature segment that pays the first contracts.
- Biodiversity is the prize of the 2040s–2050s — precisely because its measurement standard is still unformed. We carry the biodiversity figures as a ceiling on the opportunity, not as contracted demand.
The honest read
The weakest link in this sizing is the data-spend share — how much of each instrument flow is really spent on data is triangulated from cost benchmarks, not read off public line-items, so the SAM is an honest range rather than a precise point. The long-range biodiversity upside rests on a narrow set of demand research, which is why we treat it as a ceiling. The whole optimistic case is conditional on one thing: the market resolving its integrity and trust problem — which is exactly what CeibaQ is built to underwrite.